Trend Time (PTT)

Collaboration with Paul Cryptoformation

Easily analyze the duration of trends for any asset, and use this information to make informed investment decisions.

Paul Cryptoformation Trend Time Desktop
Profile Type

Medium and Long Term

Level of Use

Easy

Indicator Type

Technical information metrics

Customization

Low

Timeframes

Daily

Paul Cryptoformation Trend Time Mobile

Purpose

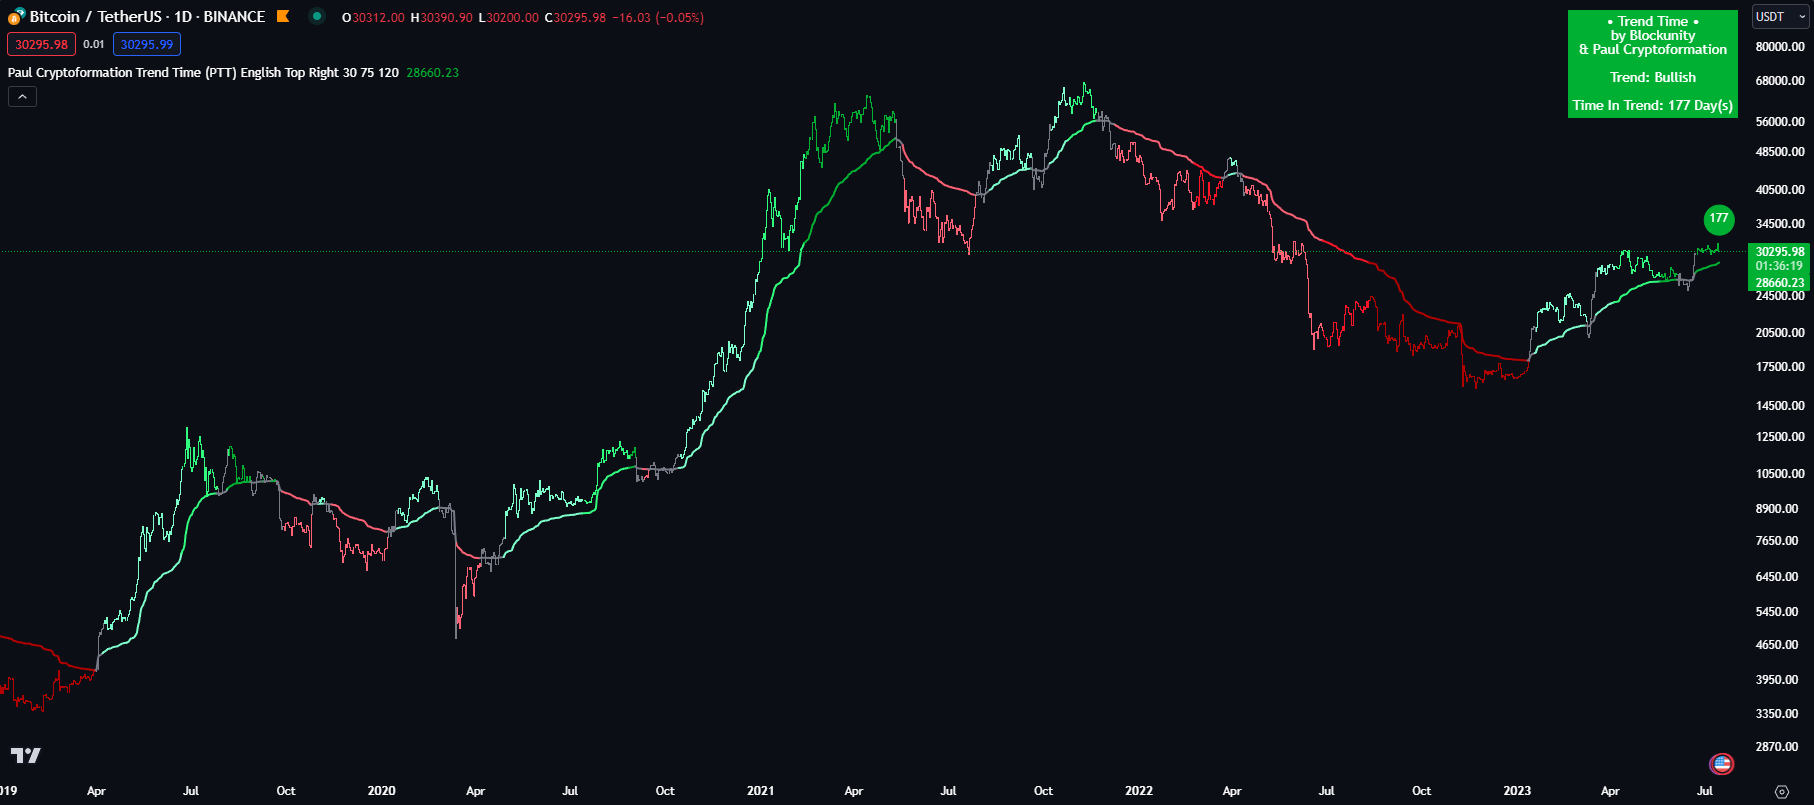
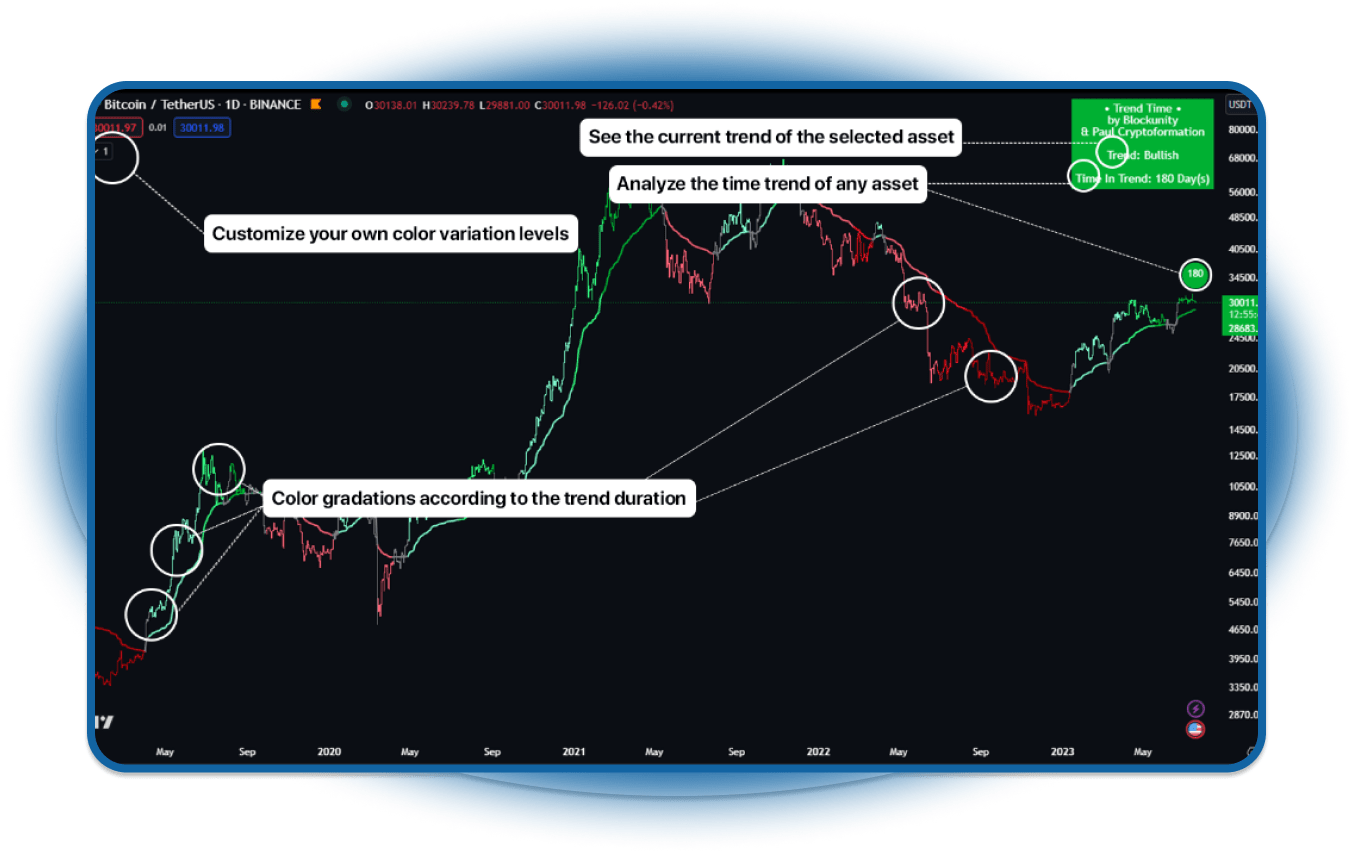
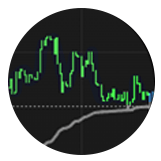
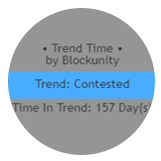
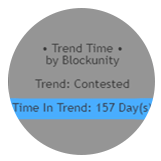
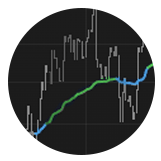
The Trend Time indicator, as its name suggests, can be used to analyze the trending time of any asset. A color gradient lets you visualize the duration of a trend effectively. You can customize your own trigger levels for the different color variations. Finally, you can also find the current trend state of the selected asset.

Works on

All Assets

All Assets

All Pairs

All Pairs

Crypto Market

Crypto Market

Traditional Market

Traditional Market

Thrive with the PTT

Gain insights into the time trend of any asset with the PTT. Visualize trend duration using color gradients, customize color variations, and stay updated on the current trend of your selected asset.

Trend Duration

Gain valuable insights into the duration of different trends. The PTT provides a comprehensive analysis of trend lengths, helping you identify short-term, medium-term, and long-term trends for more accurate decision-making.

Customizable & Colorful

Visualize trends effectively with the customizable color gradient. Customize your own color scheme to represent different trend durations, allowing for easy identification and analysis of trend patterns.

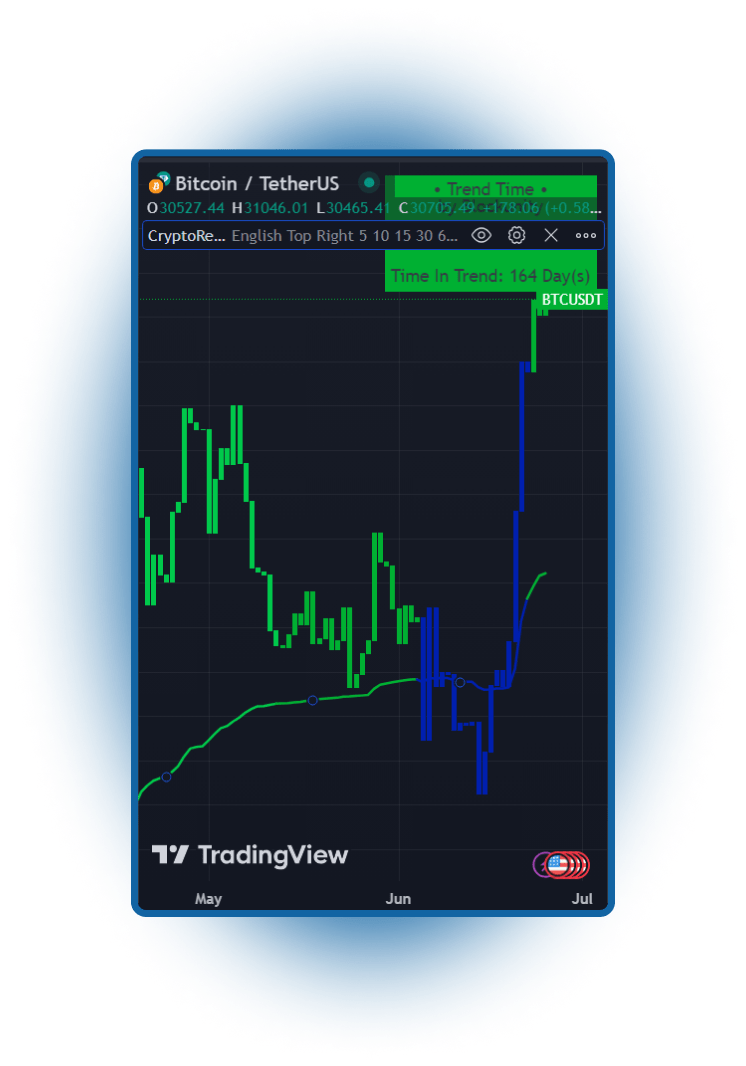
Real-Time Trend Status

Stay up to date with the current trend status of your selected asset. The PTT provides a real-time trend indicator, showing whether the asset is in an uptrend, downtrend, or in a consolidation phase.

Timing Analysis

Optimize your entry and exit points with the PTT’s timing analysis. It provides insights into the timing of trends, helping you identify potential trend reversals and maximize your trading opportunities.

Elements

The user can find different elements and signals that form the indicator structure. Each one is adding another value to the whole indicator.

Color Gradient

A customizable color gradient that represents the duration of the trend. You can define your own color variations and levels to suit your preferences.

Trend Duration

This element helps you understand the length of specific trends, enabling you to make more informed decisions regarding entry and exit points.

Trend Status

This element highlights whether the asset is in an uptrend, downtrend, or consolidation phase.

VAMA

The Volatility-Adjusted MA (VAMA) is an evolved moving average that takes into account the volatility of the asset to better reflect the state of the market.

Leverage your Trading & Investing with the

Trend Time

Get the PTT

Magic Bands
Only

49.99€ /month

39.99€

/month


Premium
Plan

69.99€ /month

49.99€

/month

7 Days Free

The Premium plan include:

  • Premium Suite (12 indicators, 2 trading strategies, 7 analysis tools and 3 indexes).

  • Real-time alerts & non-repaint signals.
  • Full access to our active Discord community.

  • Future indicators, features and updates.

  • Weekly Market Report [in french only for now].

  • Advanced Support.

Discover all our tools by clicking here.

News & Updates

To ensure continuous improvement, we closely control each Unyx Data offering and regularly implement updates, ensuring that they remain aligned with evolving market dynamics. All updates are included in our subscriptions.

Trend Time AfterTrend Time Before