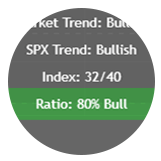
Stockmarket Index (BSI)
Easily visualize the overall state of the traditional market, while benefiting from an analysis of the underlying trend thanks to real-time monitoring of a multitude of assets.
Purpose
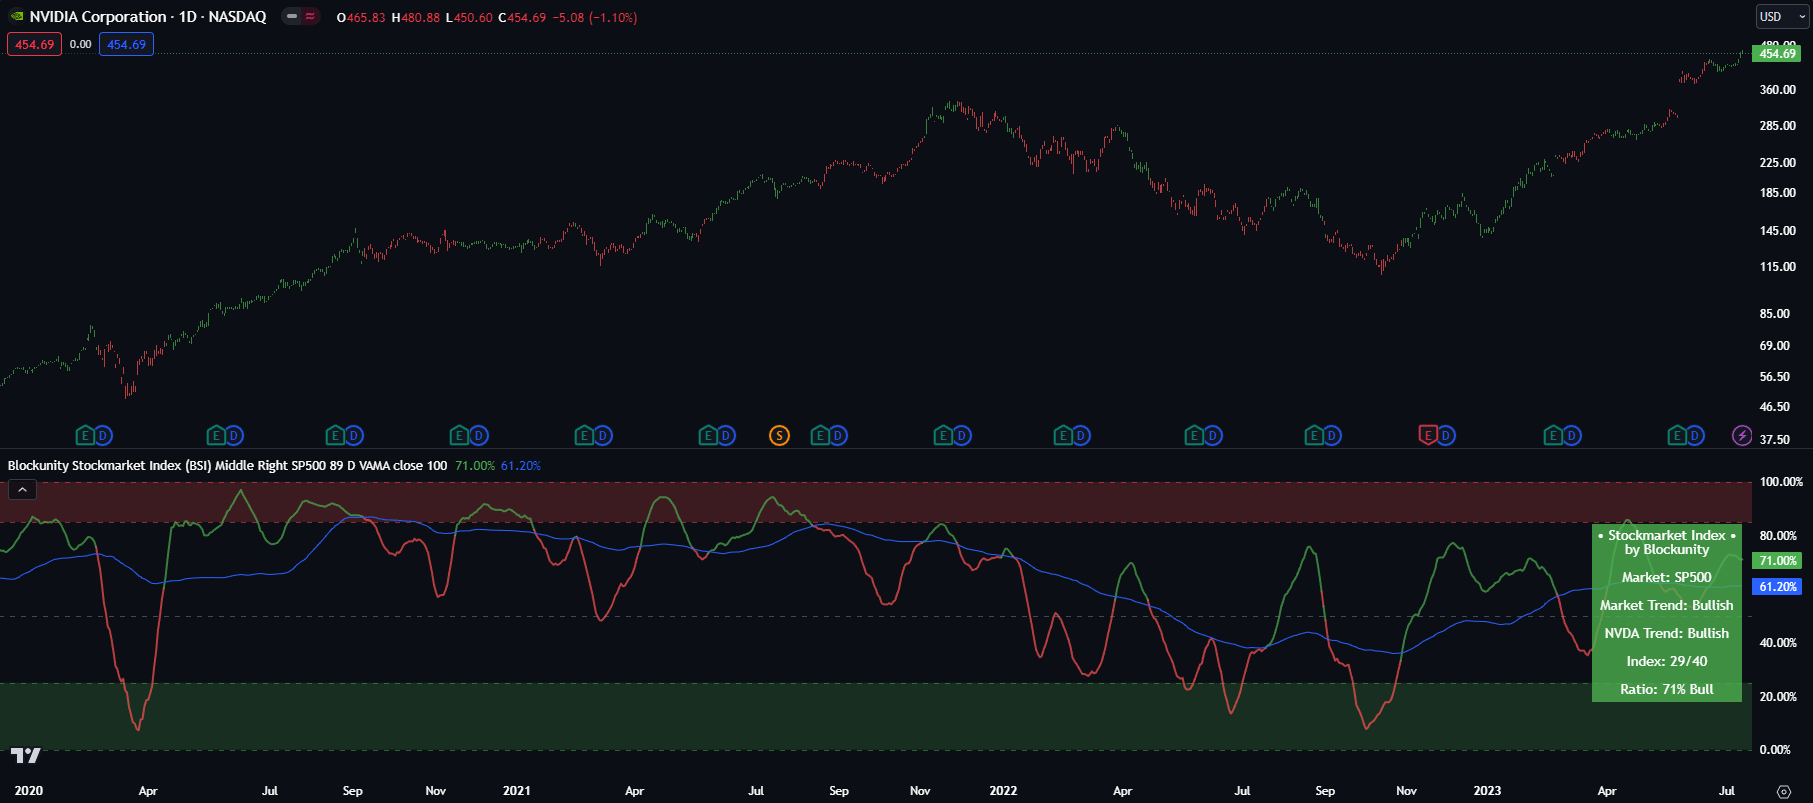
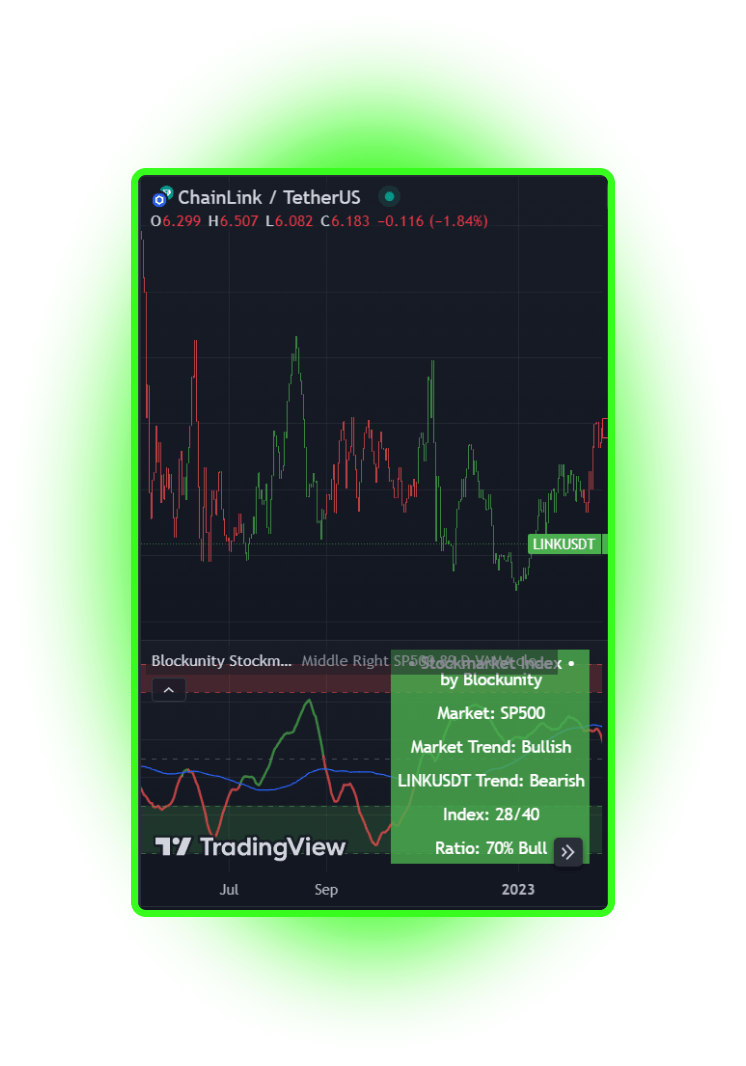
Visualize at a glance the global trend of the traditional market. This indicator takes into account the state of the top 40 NASDAQ, SP500 or CAC40 assets, depending on your choice in the indicator parameters. It gives you the market trend and strength in the form of an index and a ratio. The high and low bounds of the oscillator can also be used to identify potential oversold or overbought zones. In addition, you can find the colors of the market’s state directly on your chart.
Works on

All Assets

Traditional Market
Thrive with the BSI
This is the ultimate tool to effortlessly visualize and gauge the global state of the traditional market, providing trend insights and market sentiment in a single glance.
Global Market Trend
Stay ahead of the game with our BSI indicator, providing a comprehensive view of the global market trend, allowing you to make informed decisions based on the current state of the traditional market.
Customizable Index
Trend Analysis and Strength
Gain valuable insights into the market trend and its strength with the BSI, using trend analysis tools and indicators to identify potential opportunities and gauge market sentiment.
Color-Coded Visualization
Effortlessly interpret market conditions with the color-coded visualization of the BSI, enabling you to quickly assess the bullish or bearish nature of the market and make timely investment decisions.
Elements
The user can find different elements and signals that form the indicator structure. Each one is adding another value to the whole index.
The Premium plan include:
Discover all our tools by clicking here.
News & Updates
To ensure continuous improvement, we closely control each Unyx Data offering and regularly implement updates, ensuring that they remain aligned with evolving market dynamics. All updates are included in our subscriptions.
