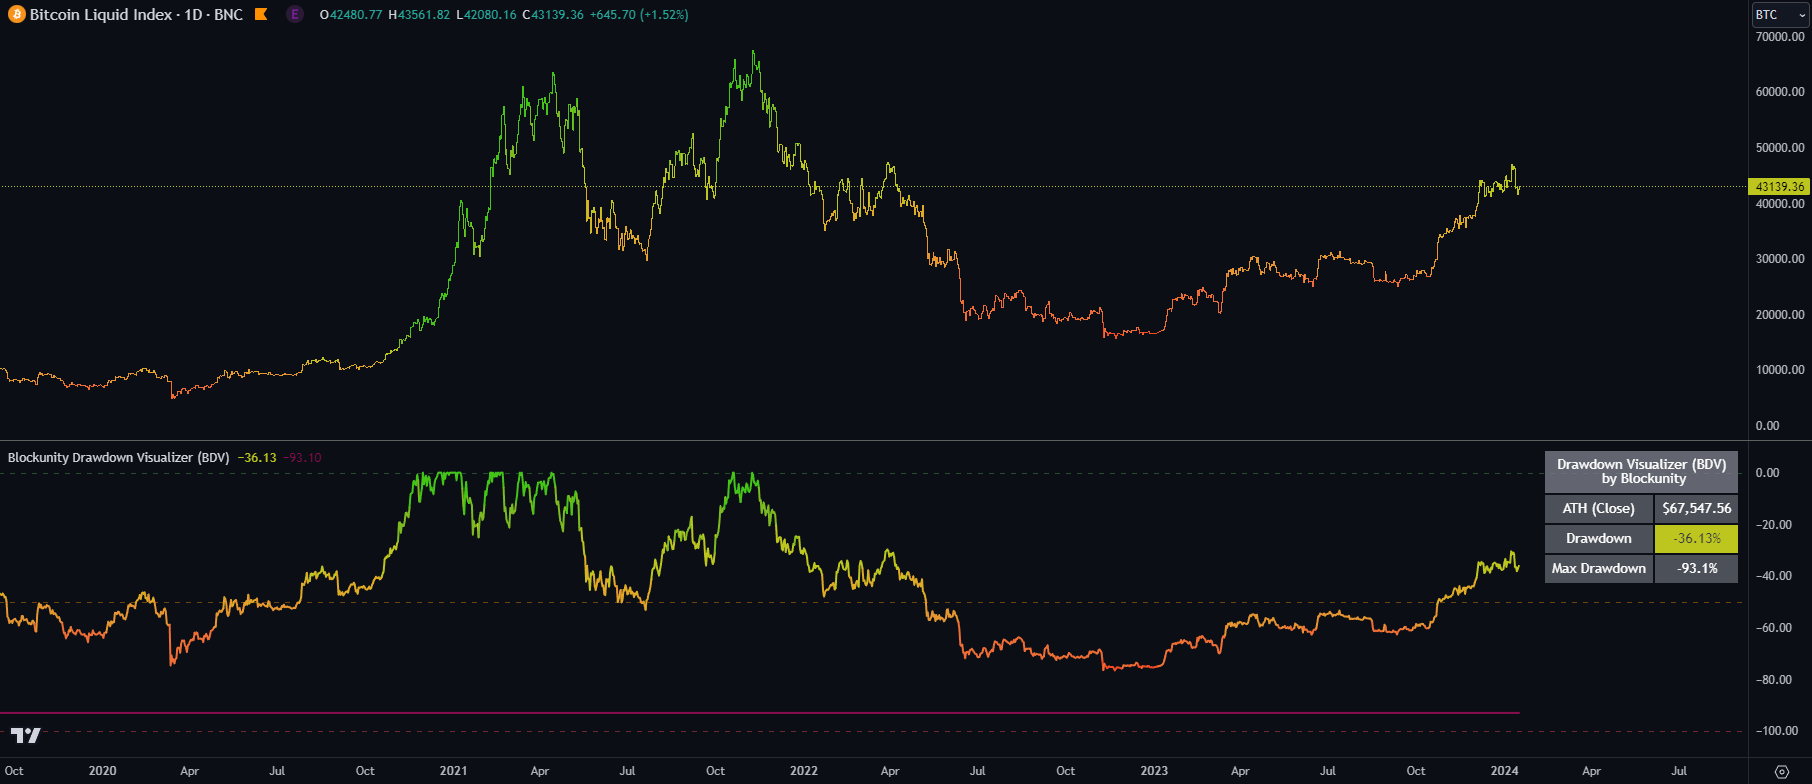
Drawdown Visualizer (BDV)
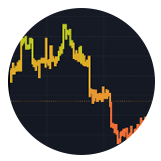
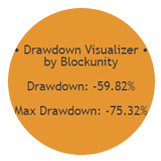
Monitor the drawdown (value of the drop between the highest point and the current price) of assets and act accordingly to reduce your risk.
Purpose
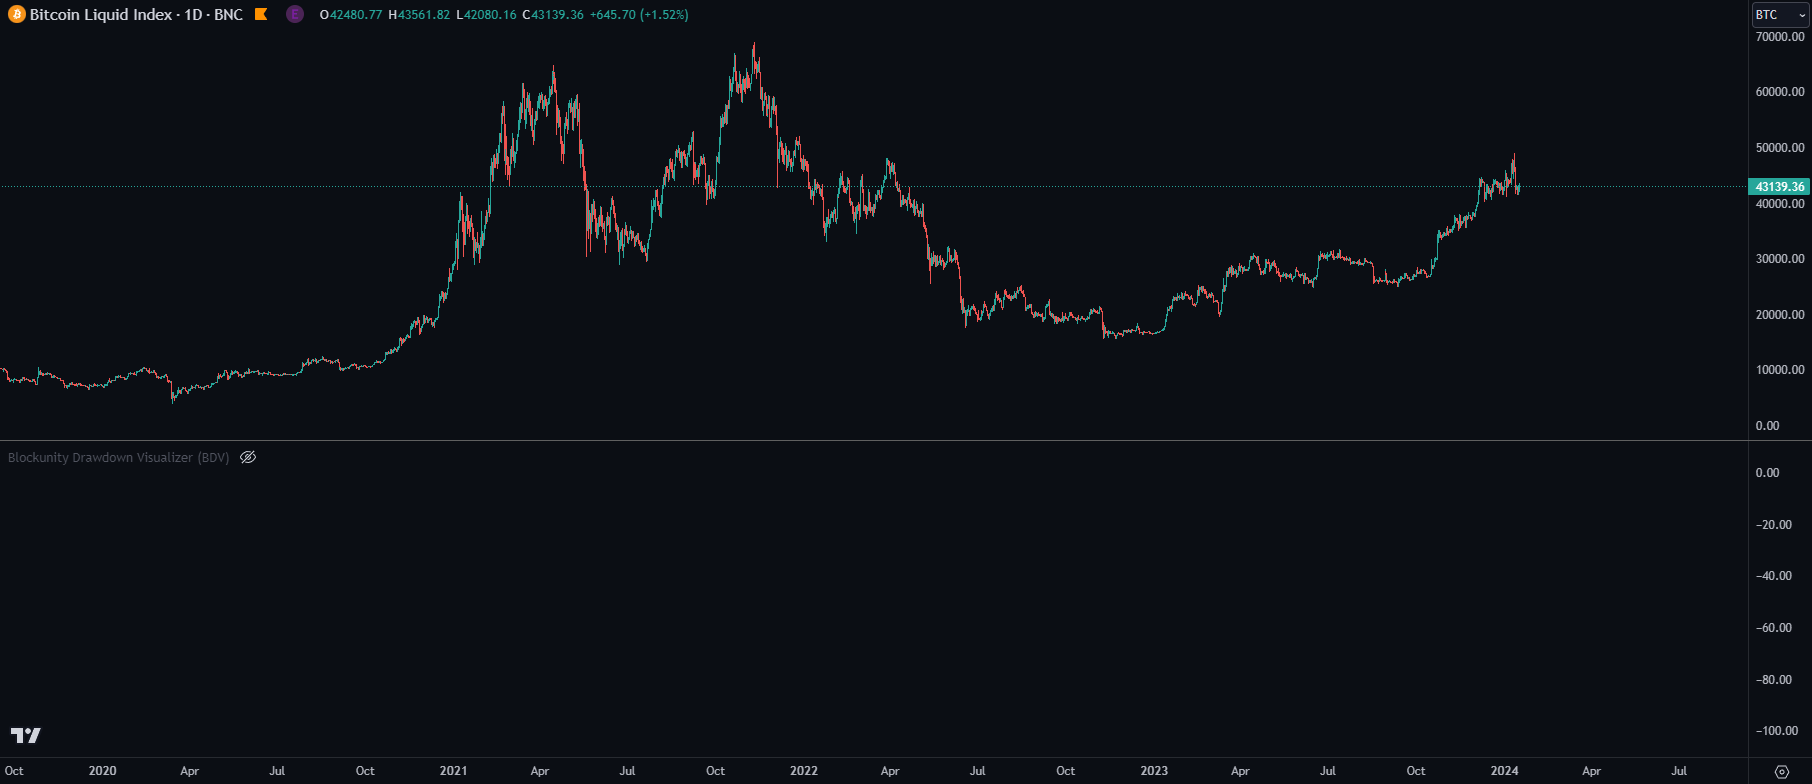
Introducing BDV, the incredibly intuitive metric that visualizes asset drawdowns in the most visually appealing manner. With its color gradient display, BDV allows you to instantly grasp the state of retracement from the asset’s highest price level. But that’s not all – you have the option to display the oscillator’s colorization directly on your chart, enhancing your analysis even further. Gain a clear understanding of drawdowns with BDV and elevate your trading insights to new heights.
Works on

All Assets

All Pairs

Crypto Market
Traditional Market
Thrive with the BDV
Visualize drawdowns with ease using BDV, the intuitive metric that provides a clear, color-gradient display of retracement levels from an asset’s highest price, empowering you with valuable insights for informed trading decisions.
Instant Visual Grasp
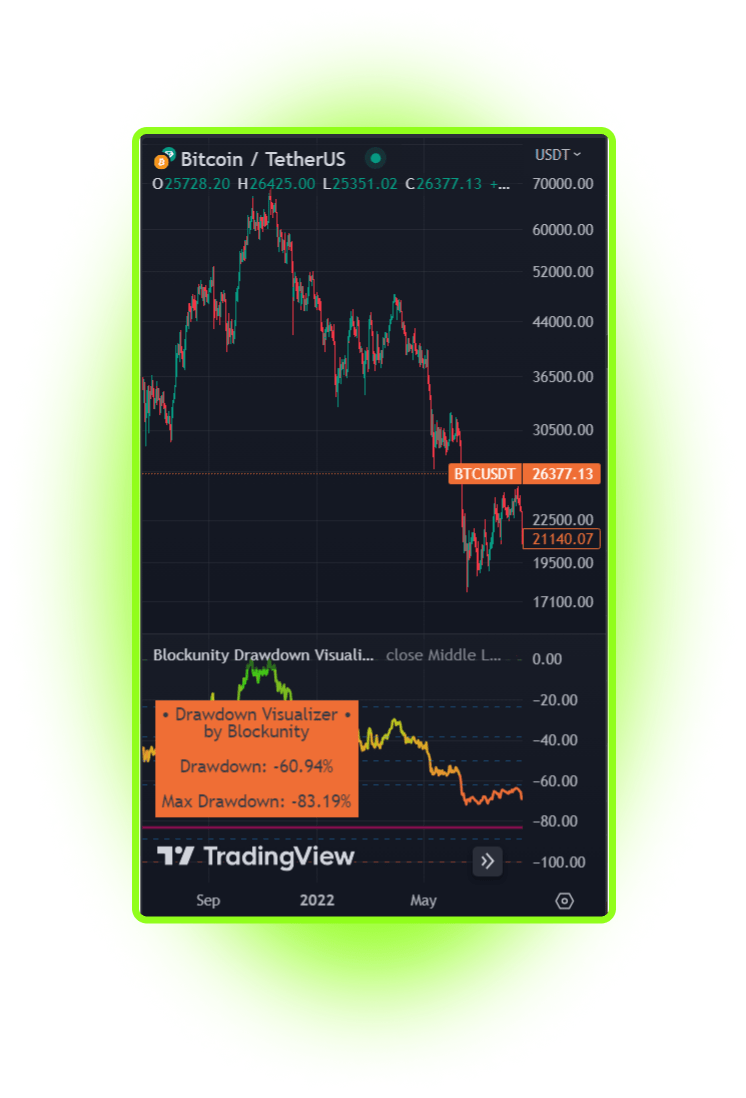
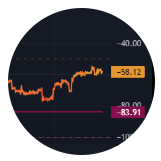
Experience instant visual grasp of asset drawdown, BDV is the intuitive metric that presents retracement levels in a visually appealing color-gradient display.
Enhanced Analysis
Elevate your analysis with enhanced insights, as the option to display the oscillator’s colorization directly on your chart takes your trading strategies to new heights.
Easy-to-read Display
Clearly visualize retracement levels with BDV’s easy-to-read display, allowing you to effortlessly understand retracement depths and make informed trading decisions.
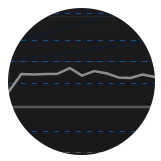
Fibonacci Retracements
Observe fibonacci levels directly to gain an overview and act with peace of mind.
Elements
The user can find different elements and signals that form the indicator structure. Each one is adding another value to the whole indicator.
News & Updates
To ensure continuous improvement, we closely control each Unyx Data offering and regularly implement updates, ensuring that they remain aligned with evolving market dynamics. All updates are included in our subscriptions.