Rainbow Score (BRS)
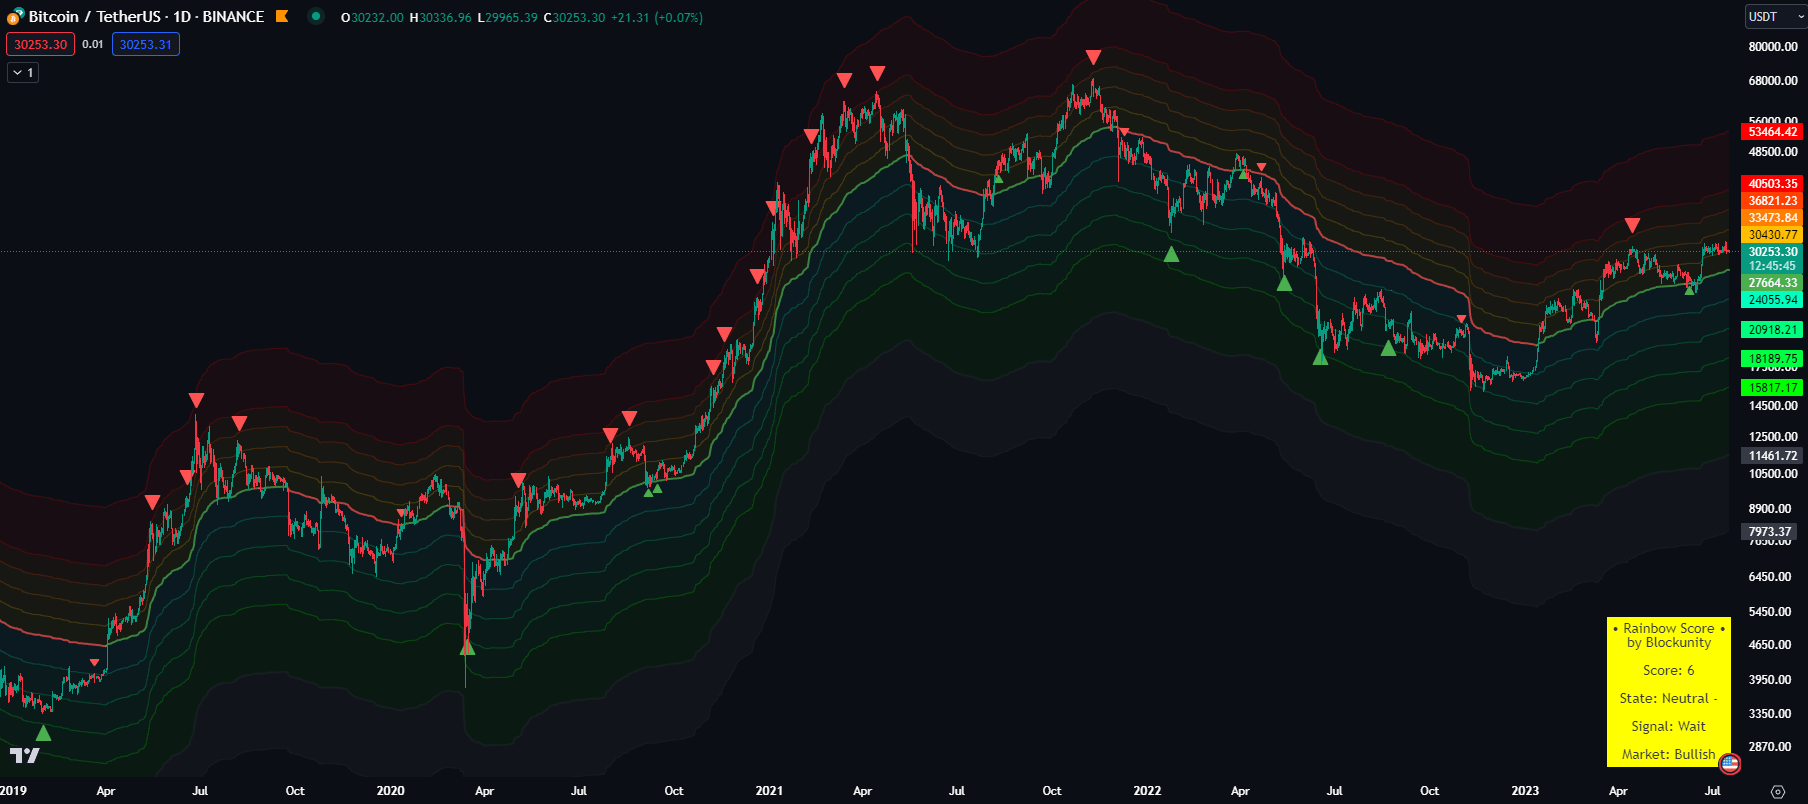
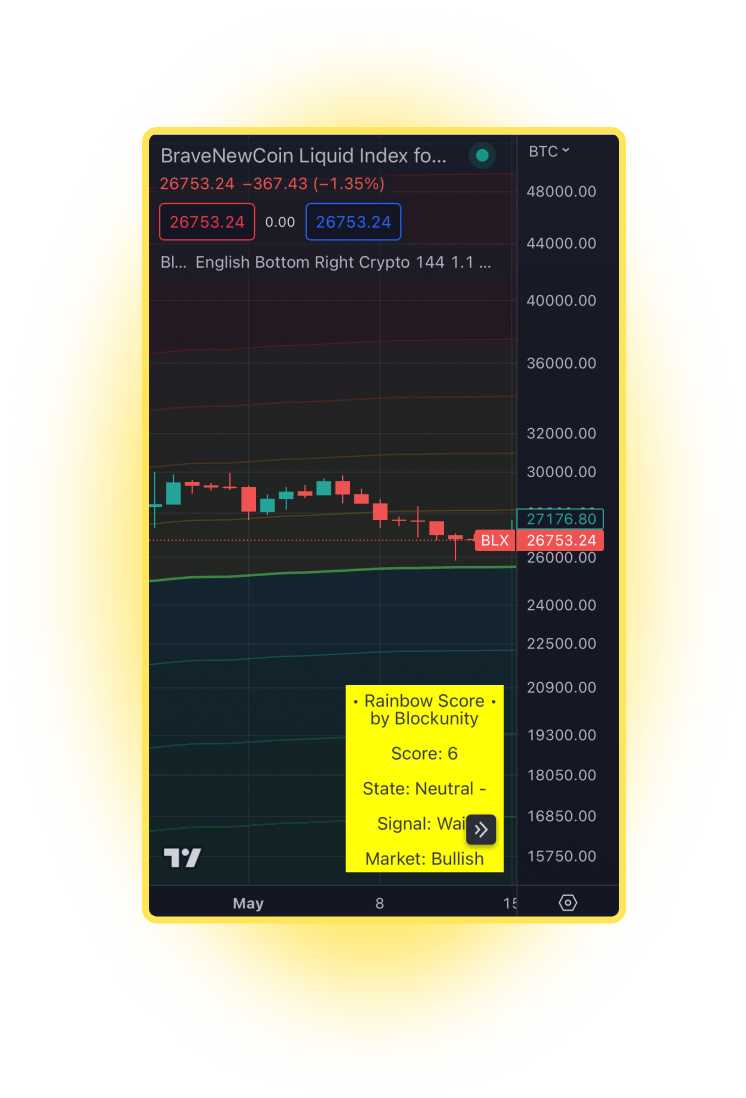
Simplify your analysis and optimize your positions with this indicator providing buy and sell zones using colored bands and arrows.
Purpose
Using a mix of advanced technical analysis tools, this handy indicator is like a compass for investors. It points out the buy or sell zones for any asset quickly and easily. It turns complex financial data into a simple, color-coded chart with scores. Plus, it uses arrows to show where the investment opportunities might be. This tool makes the tough world of investment much simpler, helping traders make smarter decisions with confidence and ease.
Works on

All Assets

All Pairs

Crypto Market
Traditional Market
Thrive with the BRS
Our powerful indicator offers a seamless way to decode complex financial data, efficiently highlighting buy or sell zones, simplifying investment decisions, and offering versatility across diverse asset classes.
Surf the Trend
By surfing the trend, traders can capitalize on the momentum and increase the likelihood of making profitable trades, as the trend often provides a higher probability of continued price movement in a specific direction.
Overbought & Oversold
Simplified Decision Making
Universal Applications
Given that this indicator is based on multiple technical analysis metrics, it can be applied to any asset, providing wide-ranging utility for various investment portfolios.
Elements
The user can find different elements and signals that form the indicator structure. Each one is adding another value to the whole indicator.
The Premium plan include:
Discover all our tools by clicking here.
News & Updates
To ensure continuous improvement, we closely control each Unyx Data offering and regularly implement updates, ensuring that they remain aligned with evolving market dynamics. All updates are included in our subscriptions.