| Rainbow Score (BRS) |
- Buy and sell signals.
- Change from zone 9 to 10.
- Change from zone 8 to 9.
- Change from zone 3 to 2.
- Change from zone 2 to 1.
|
- {Asset}: {Buy/Sell} signal on timeframe {tf}.
- {Asset} entered score {1/2/9/10} on timeframe {tf}.
|
|
| Unyx Bands (BUB) |
- Trading signals (Long, Short, Close, Stop Loss).
|
- {Asset}: Open {Long/Short} on timeframe {tf}.
- {Asset}: {Trend Stop Loss/Stop Loss} Close {Long/Short} on timeframe {tf}.
|
|
| Bitcoin Cycle Synthesis (BCS) |
BCS 1/2
- Bullmarket/Bearmarket confirmation.
- MM200 in buy or sell zone.
- Top/Bottom signals.
BCS 2/2 (Oscillator)
- RSI enters buy/sell zone.
- Hash Ribbon buy signal.
- Puell Multiple enters/leaves buy/sell zone.
|
- {Bullmarket/Bearmarket} confirmed!
- 200 Moving Average enters {Buy/Sell} zone on timeframe {tf}.
- {Top/Bottom} signal on timeframe {tf}.
- RSI enters {Buy/Sell} zone on timeframe {tf}.
- Hash Ribbon enters Buy zone on timeframe {tf}.
- Puell Multiple {enters/exits} {Buy/Sell} zone on timeframe {tf}.
|
|
| Ultimatyx Screener & Oscillator (BUX) |
BUO (Oscillator)
- Strong overbought or oversold signal.
|
- {Asset}: {Overbought/Oversold} signal on timeframe {tf}.
|
|
| On-chain Suite (BOS) |
- Percentage over/under held by Whales over 7 days (only if variation of -/+ 3%).
- Number of Whales up or down over 7 days, as well as the percentage of the offer held.
|
- {X}% {more/less} held by whales on {Asset} over the last 7 days.
- {X} {new/less} whales since last week, for a total of {X}, holding {X}% of the {Asset} supply.
|
|
| Reversal Identifier (BRI) |
- BSR buy and sell signals.
- RSI Slope buy and sell signals.
- Bullish and bearish breakout signals.
- Trap signals.
|
- {Asset}: {Buy/Sell} signal from BSR on timeframe {tf}.
- {Asset}: {Buy/Sell} signal from RSI Slope on timeframe {tf}.
- {Asset}: {Bullish/Bearish} {Breakout/Trap} on timeframe {tf}.
|
|
| Trend Identifier (BTI) |
- Vegas Daily changes trend.
- Vegas Daily retest signal.
|
- {Asset}: Daily Vegas Cloud is now {Bullish/Bearish}.
- {Asset}: Daily Vegas Cloud {bullish/bearish} retest in progress.
|
|
| Pivot Identifier (BPI) |
- New ATH or ATL.
- New intermediate ATH or ATL.
|
- {Asset} reached a new All Time {High/Low} at {$X}.
- {Asset} reached a new Intermediate All Time {High/Low} at {$X}.
|
|
| Drawdown Visualizer (BDV) |
- New Max Drawdown.
- Drawdown falls below -25% / Drawdown recovers -25%.
- Drawdown falls below -50% / Drawdown recovers -50%.
- Drawdown falls below -75% / Drawdown recovers -75%.
|
- {Asset} reached a new Max Drawdown at ${X}.
- {Asset} {reclaimed/crossed under} {-75%/-50%/-25%} Drawdown.
|
|
| Volatility Bands (BVB) |
- Trading signals (Long, Short, Close, Stop Loss).
|
- {Asset} enter {first/second/third} {long /short} position on timeframe {tf}.
- {Asset}: Close all positions on timeframe {tf}.
|
|
| Bitcoin ETF Tracker (BET) |
- Total volume variation in 24h (if variation -/+ 50%).
|
- Total Volume of Bitcoin ETFs has changed by {X}% over the last 24 hours.
|
|
| Excess Index (BEI) |
- Buy or sell signals.
- Exceeding upper or lower extension.
|
- {Asset}: {Buy/Sell} signal from BSR on timeframe {tf}.
- {Asset} exits {upper/lower} extension on timeframe {tf}
|
|
| Stablecoin Liquidity (BSL) |
- Aggregate liquidity status and variation over 30 days (alert sent every 30 days).
|
- Aggregated Stablecoin Liquidity is at ${X} with a monthly variation of {X}%.
|
|
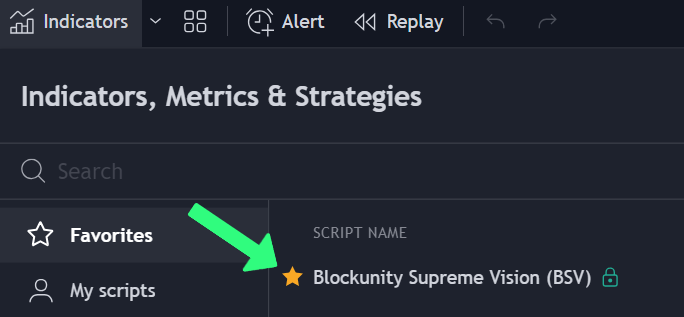
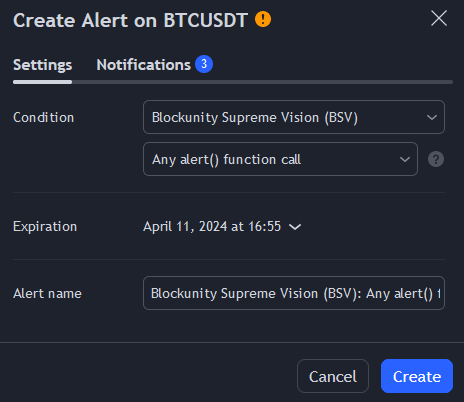
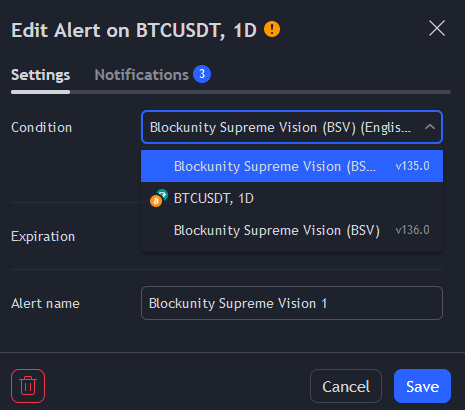
| Supreme Vision (BSV) |
- Buy or sell signals.
- Entry into Accumulation / Distribution / Caution zones.
- Monthly summary of asset and market trends, as well as asset state zone and drawdown.
|
- {Asset}: {Buy/Sell} signal on timeframe {tf}.
- {Asset} entering {Accumulation/Distribution/Caution} zone on timeframe {tf}.
- End of month BSV Recap: {Asset} trend is {Bullish/Bearish/Contested} and state is in {Accumulation/Distribution/Caution} zone. Market state is {Oversold/Overbought/Neutral}. Drawdown is {X}%.
|
|
| Gap Detector (BGD) |
|
|
|
| Fibonacci Score (BFS) |
- The asset enters the 0, 1 or 2 retracement zones on the “all time history”.
|
- {Asset} has now a retracement score of {0/1/2} on all time history.
|
|
| Altseason Index (BAI) |
- Change in seasonality state.
- Monthly summary of seasonality state, Bitcoin dominance and index ratio.
|
- State of seasonality change: {State}.
- End of month Altseason Index recap: Bitcoin Dominance is at {X}%. BTC Dominance (Excluding Stablecoins) is at {X}%. Index Ratio is at {X}. {State}.
|
|
| Market Index (BMI) |
- Change in market trend.
- Monthly summary of market trend and index ratio.
|
- New {Market} Market Trend: {Bullish/Bearish/Neutral} ({tf}).
- {Market} Market Index end of month recap: Trend is {Bullish/Bearish/Neutral}. Index at {X}/{X}. Ratio is {X}% Bull.
|
|
| |
|
|
|
| Money Printer Index (BMP) |
|
- Money Printer Index changes state to: {Printing Brrrr/Decreasing/Increasing/No Printing}.
|
|
| Central Banks Variation (BBV) |
- Weekly summary with 7-day variation.
- Monthly summary with 30-day variation.
- Quarterly summary with 90-day variation.
|
- Central Bank Variations {weekly/monthly/quarterly} change: {X}%.
|
|
| Ownership Segmentation (BOS) |
- Monthly summary of the percentage of Whales, Investors and Retail.
|
- Ownership Segmentation end of month recap. Whales: {X}%. Investors: {X}%. Retail: {X}%.
|
|
| Profile Segmentation (BPS) |
- Monthly summary of Hodlers, Cruisers and Traders percentages.
|
- Profile Segmentation end of month recap. Hodlers: {X}%. Cruisers: {X}%. Traders: {X}%.
|
|
| |
|
|
|
| Magic Bands (PMB) |
- Buy and sell signals (including early signals).
- Change from zone 9 to 10.
- Change from zone 8 to 9.
- Change from zone 3 to 2.
- Change from zone 2 to 1.
- Trend becomes Bullish/Bearish.
|
- {Asset}: {[Early] Buy/Sell} signal on timeframe {tf}.
- {Asset} entered zone {1/2/9/10} on timeframe {tf}.
- {Asset} trend is now {Bullish/Bearish} on timeframe {tf}.
|
|
| Trend Time (PTT) |
- Trend time > 60 days.
- Trend time > 90 days.
- Trend time > 120 days.
|
- {Asset} in {Bullish/Bearish/Contested} trend for {60/90/120} days.
|
|
| Divinetrend (BDT) |
|
- {Asset} trend changes to {Bullish/Bearish/Contested} on timeframe {tf}.
|
|
| Supply Augmentation (PSA) |
- Percentage change in supply (only if -/+ 3%).
|
- {Asset}: In the last 24 hours the supply {increased/decreased} by {X}%.
|
|
| Master Oscillator (BMO) |
- Addresses in profit surpass 90% or fall below 10%.
- Strong realized profits or losses.
- Variation in the proportion of whales over 30 days (only if the variation is +/- 3%).
- Variation in the proportion of long-term holders over 30 days (only if the variation is +/- 5%).
- Asset enters strong overbought or oversold condition.
- Monthly summary of the percentage of addresses in profit, the proportion of Whales and long-term Holders, the state of market liquidity, and the asset’s state of overheating.
|
- {Asset} addresses in profit represent now {X}%.
- {Asset} high amount of {losses/profits} realized today! (Index at: {X}/100).
- {Asset}: {Whales proportion/Long-term Holders} varied by {X}% over the last 30 days!
- {Asset} is {[Heavily] Oversold/Overbought} on timeframe {tf}.
- End of month BMO recap for {Asset}: The proportion of Addresses in Profit is {X}%. The Whales proportion is {X}%. Long-term Holders represent {X}%. The Stablecoin Liquidity is {Increasing/Decreasing}. The FIAT printing state is {Printing Brrrr/Decreasing/Increasing/No Printing}. And {Asset} is in a {[Heavily] Oversold/Overbought} state.
|
|