Excess Index (BEI)
Identify excess zones resulting in market reversals by visualizing price deviations from an average.
Purpose
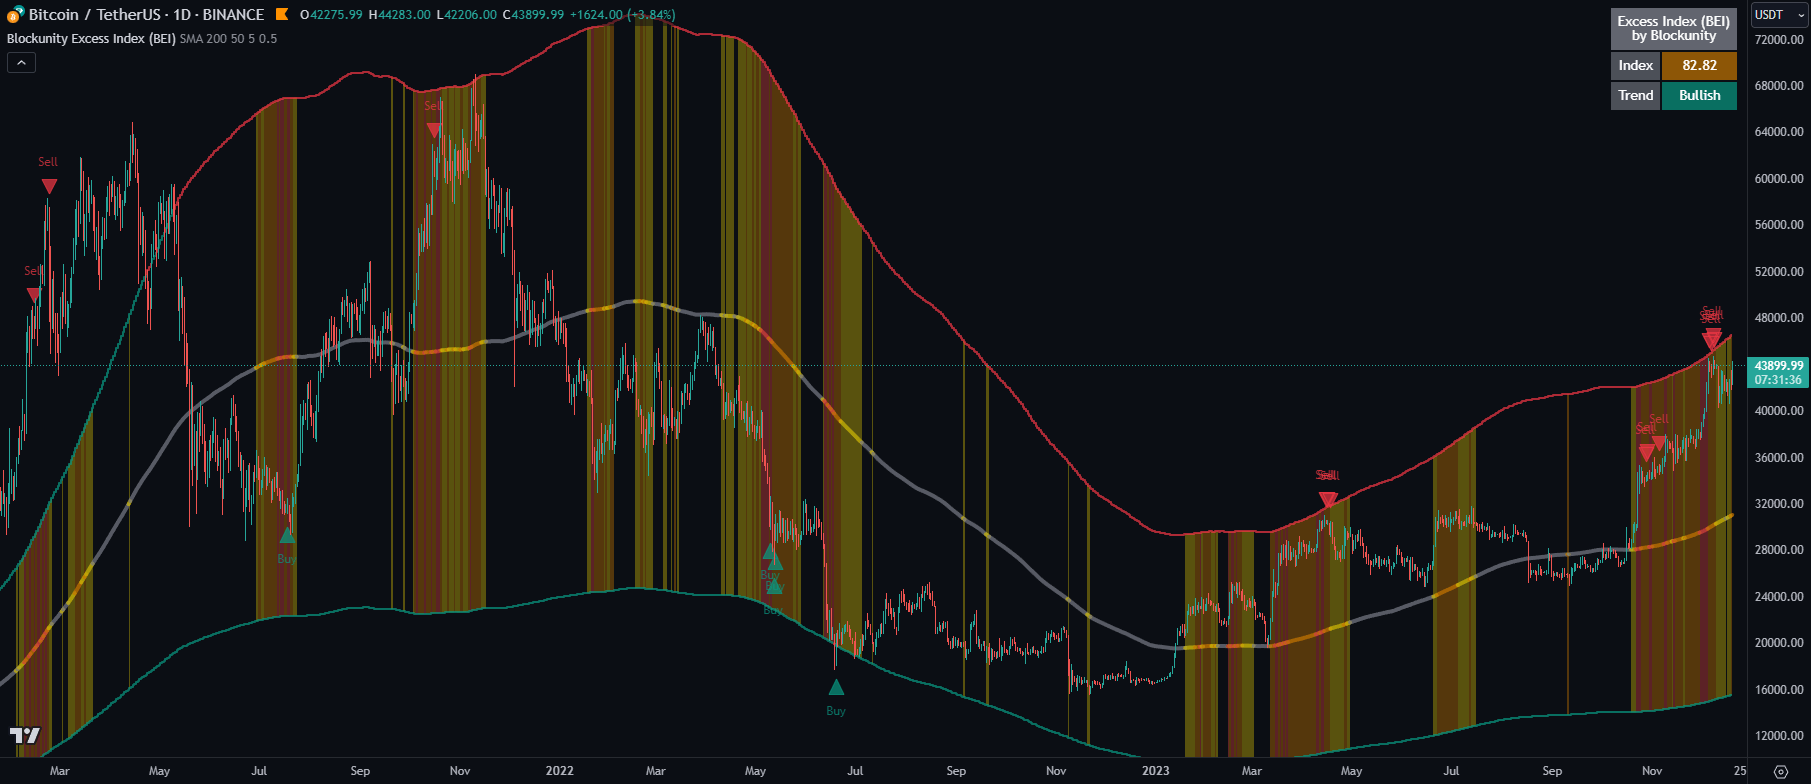
The Excess Index (BEI) is designed to identify excess zones resulting in reversals, based on price deviations from a moving average. This moving average is fully customizable (type, period to be taken into account, etc.). This indicator also multiplies the moving average with a configurable coefficient, to give dynamic support and resistance levels. Finally, the BEI also provides reversal signals to alert you to any risk of trend change, on any asset.
Works on

All Assets

All Pairs

Crypto Market

Traditional Market
Thrive with the BEI
From efficient identification to dynamic support and resistance, Excess Index equips you with the insights needed to navigate markets and thrive in diverse trading scenarios.
Identify Reversal
Identifies zones of excess, paving the way for market reversals. Its unique approach visualizes price deviations from a customizable moving average.
Versatile Application
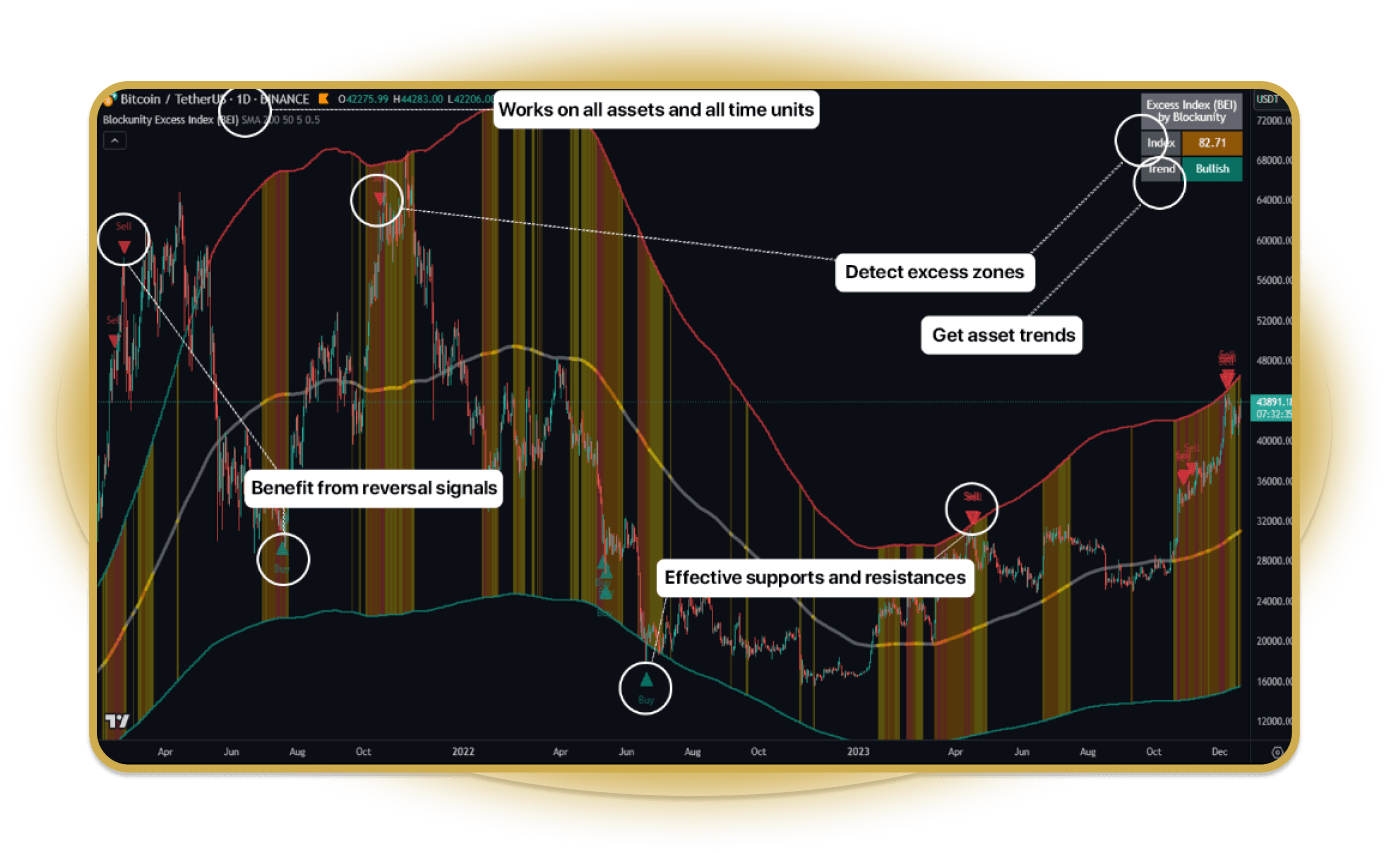
Works seamlessly on all assets and time units. Whether you’re analyzing stocks, cryptocurrencies, or commodities, BEI provides valuable insights into excess zones.
Dynamic Key Levels
Benefit from effective supports and resistances. This dynamic approach helps you navigate market fluctuations with a clearer understanding of potential reversal points.
Timely Signals
BEI doesn’t just identify excess; it provides timely reversal signals, alerting you to potential trend changes. Stay ahead in the market with actionable insights on any asset.
Elements
The user can find different elements and signals that form the indicator structure. Each one is adding another value to the whole indicator.


News & Updates
To ensure continuous improvement, we closely control each Unyx Data offering and regularly implement updates, ensuring that they remain aligned with evolving market dynamics. All updates are included in our subscriptions.